I have encountered phrases over and over again such as revenue is down from last month or February is a bad month. I’m going challenging both of these concepts with insights as to the revenue cycle. After all, it’s called revenue cycle and not revenue linear.
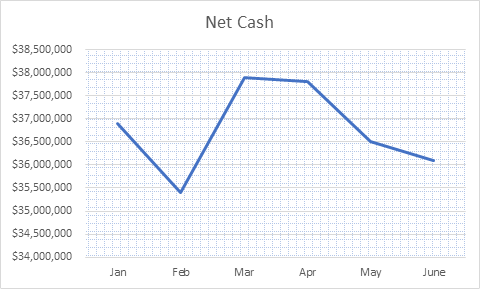
 In reviewing financial performance I have seen many organizations fall into the trap of looking at cash flows in the context of the month to month comparisons. (These are fictitious numbers, but reflective of intervals I have seen within organizations). The downfall of this approach is that cash flow across healthcare organizations is not static.
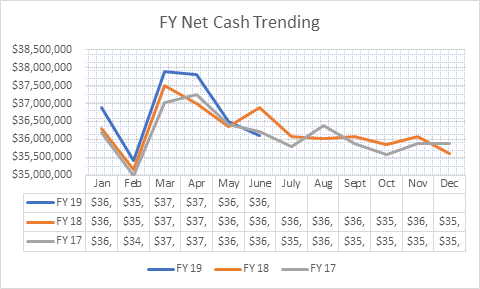
Instead, as a rule of thumb, you’ll find cash posting totals higher in spring months such as March and April and lower in the winter season. There are a variety of factors impacting the cash cycle, the crux of this article is to understand that it is indeed a cycle and to forecast accordingly. There are many components contributing to this, a few of which will be discussed later on. Moreover, I have seen many organizations that based upon their annual budget set a monthly target or goal for cash. The breakdown that transpires from this method is that staff are not pushed to a higher drive in the most collectible months whilst the lower months in the cycle are seen as lacking.

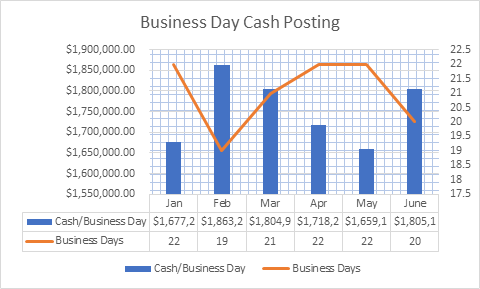
Rather than noting February as a low cash posting month, instead let’s shift our focus to review the cash posted per business day. In doing so, you’ll likely find that February is actually a pretty healthy month in terms of daily cash posting. Focusing back to 2019, each respective month has the associated number of business days depicted in the graph. We can clearly see that February and June have actually had the largest daily cash posting.
And this is where the Medicare elves come in. Actually, that’s not quite right. You see, there are no Medicare elves or some such fantastical creature processing claims on federal holidays. What this means for us as revenue cycle leaders are that the cash flow is impacted. Our monthly cash goals should account for the holidays and subsequent lags in receiving/posting payments from claims that otherwise would have been processed on that day. Rather than establishing a flat monthly cash goal, let’s instead look at the annual cash requirements and divide this into the total number of business days for the upcoming fiscal year.
Now we know the total amount that must be posted each day. You may be asking yourself, what about the revenue cycle instead of a linear part? This is where we pause to consider routine external forces or seasonality. Let’s first consider our payer mix as this will impact the forecasting and should be customized accordingly. A higher portion of patient balances is unpaid in December as holidays create a divergence of priorities. It’s customary to receive 3 statements so bills that arrive in December have a lower percentage of payment than those arriving during tax return season. If the healthcare provider has a larger portion of self-pay services the cash posting goals for these respective months will need a greater adjustment than for providers with lower self-pay percentages.
On to our wonderful counterparts, the payers! Remember, they are staffed by people just like health providers, meaning their staff take a vacation, enjoy holidays, and from time to time also take sick days. They have fiscal year end pressures just like the rest of us, working day in and day out processing all those claims we submit. It’s not a light undertaking and one that is imperative to our fiscal well-being.
Everyone’s favorite component of the revenue cycle, the deductible season! There is a larger portion of patient responsibility during this season (payer specific) and often times we see a higher portion of scheduled services right before the next upcoming deductible period. Medicare, one of the top payers, starts in January. However, patients may opt to schedule these planned services prior to the holiday season commences. Understanding the average claims filing by payer (or financial class) coupled with the average payment cycles will help unlock the mysteries of cash projections for this significant segment of cash flow.

Mapping out cash by payer by month over the past couple of years will lend insight as to payer specific trending. Remember, past performance is the best indicator of future trends. By understanding how your payers are functioning and the impact on your cash flow you can quickly derive a plan that accounts for this trending.
This may be a lot to take in and it may seem to fly in direct contradiction to current methods. In thinking through days in A/R, which is commonly measured by taking the total A/R divided by ADR (average daily revenue). Average daily revenue is defined by taking the total Charges for the past 3 months divided by the number of days in those three months. Days in A/R accounts for the number of days in the respective months of the charge summation. This model of establishing cash trending and goal setting is similar, however, it’s a little more granular in that it focuses on business days rather than calendar days.
To recap:
- Cash goals are tailored for each respective month
- Business days are the starting point for establishing the monthly cash that should be posted
- The goal of RCM is to minimize the low points and to capitalize on the upswings
- The total monthly variation should be no more than 7% for seasonality
The inclusion of your revenue cycle tendencies along with cash goal setting by month is the best way to energize your revenue cycle staff to reach optimal cash flows. Rather than attributing strong months to great performance and lesser months to inadequacy, press in a little deeper and truly identify where your gaps and strengths are! This will help to foster a supportive environment that truly creates an environment in which your revenue cycle team can excel.